How to Use a Stock Screener With Technical Analysis
May 14, 2026
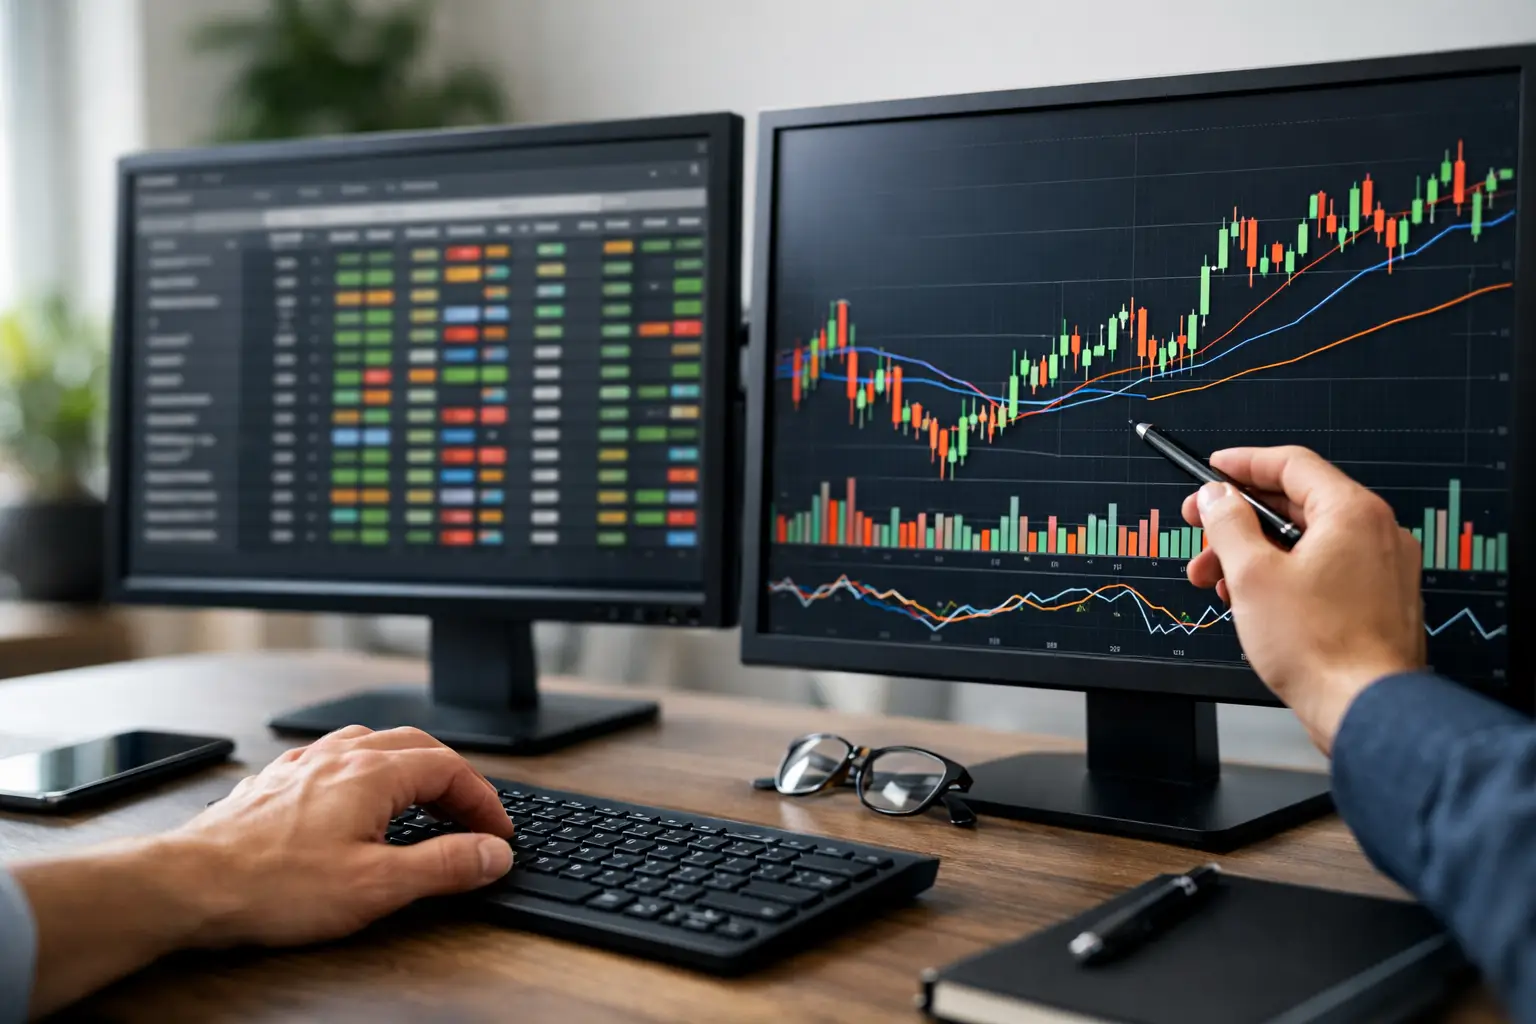
A chart can look perfect at 10:00 a.m. and untradable by lunch. That is exactly why a stock screener with technical analysis matters. It helps you filter the market before emotion, headlines, and random price action start pulling your attention in ten different directions.
\nFor most self-directed traders, the real problem is not lack of information. It is excess information with no structure. One tab shows momentum, another shows moving averages, another shows earnings data, and a fourth gives you a completely different signal. By the time you compare them all, the setup is either gone or no longer clear.
\nA better process starts with narrowing the universe fast, then validating only the names that deserve attention. That is where a technical screener becomes useful. Not because it predicts the future, but because it imposes order on a noisy market.
\nWhat a stock screener with technical analysis should actually do
\nAt a basic level, a screener filters assets based on predefined criteria. When technical analysis is added, those criteria move beyond market cap or sector and start focusing on price behavior, trend structure, momentum, volatility, and timing.
\nThat sounds straightforward, but there is a big difference between a screener that simply returns stocks above the 200-day moving average and one that helps you make an actual decision. The first gives you a condition. The second gives you context.
\nUseful technical screening usually combines several layers at once. Price above key moving averages may indicate trend strength. Relative strength can show whether the asset is outperforming peers. Volume expansion may confirm participation. Support and resistance zones can help define timing. If those pillars align, the chart becomes more than visually attractive. It becomes operational.
\nThis is also where many traders lose time. They run one filter, get a long list, then manually inspect every chart to see whether the setup is real. A good screening workflow reduces that manual burden by showing not just whether a condition exists, but whether multiple technical factors are pointing in the same direction.
\nWhy single-indicator screens often fail
\nA lot of traders begin with simple scans because they are easy to build. RSI below 30. MACD bullish crossover. Price crossing the 50-day average. These conditions can be useful, but on their own they are weak.
\nAn oversold RSI can stay oversold in a downtrend. A moving average crossover can happen after much of the move is already gone. A breakout without volume can fail quickly. Technical analysis works better when indicators confirm each other instead of competing for attention.
\nThis is the key trade-off. Simpler screens produce more results, but many of them are low quality. Tighter screens improve signal quality, but they can miss early opportunities. There is no universal setting that works in every market regime.
\nThat is why disciplined traders tend to prefer alignment over isolated triggers. They are not asking whether one indicator flashed green. They are asking whether trend, momentum, structure, and risk are coherent enough to justify attention.
\nHow to build a practical screening process
\nA useful process usually starts with the broadest filter and gets narrower step by step. First, define the universe. Are you screening U.S. large caps, European equities, ETFs, or crypto? Mixing everything into one scan often creates inconsistent results because the behavior, volatility, and liquidity profiles are too different.
\nNext, define your timeframe. A swing trader looking for 5-to-15 day moves should not use the same screen as a positional investor holding for months. Technical signals change meaning depending on the chart horizon. A bullish pattern on the daily chart may still be noise inside a weak weekly trend.
\nAfter that, screen for trend quality. This might include price above the 50-day and 200-day moving averages, improving relative strength, or a clean sequence of higher highs and higher lows. The point is not to prove that a stock is perfect. The point is to eliminate weak structures quickly.
\nThen move to setup quality. Is the asset near a breakout level, a pullback zone, or a support area with favorable risk? This is where screening becomes more valuable than simple ranking. A chart can have a strong trend and still offer a poor entry if the stop is too wide or the upside is already stretched.
\nFinally, check whether the setup is tradable in risk terms. If your potential stop loss is 8% away and the realistic target is 10%, the setup may be technically bullish but operationally mediocre. Traders often confuse good charts with good trades. They are not the same thing.
\nThe best stock screener with technical analysis is not only technical
\nPure technical filtering is useful, but it has limits. A chart may look strong right before earnings risk, a weak balance sheet event, or a broader sector reversal. This does not mean technical analysis stops working. It means context matters.
\nThat is why the stronger approach is often a hybrid one. Technical structure tells you when and where. Additional layers can help explain whether the move has broader support. Even basic checks, like trend strength across multiple timeframes or whether the asset has fundamental deterioration, can improve decision quality.
\nThis matters even more for retail traders who do not want to spend an hour validating each chart manually. If a platform can combine technical analysis, trend confirmation, and other decision layers into one readable output, it reduces friction without forcing users into a black box.
\nThat is the practical advantage of a structured system like Montbon Analytics. Instead of showing disconnected indicators, it translates multiple analytical pillars into a clear score, setup classification, and trade levels. That does not remove uncertainty, but it makes uncertainty easier to measure.
\nWhat to look for in a technical screening tool
\nIf you are comparing tools, the first question is not how many indicators they include. It is whether the output helps you act. More features do not automatically produce better decisions.
\nA strong screener should let you filter by trend, momentum, and price structure without making you build every rule from scratch. It should also make multi-timeframe analysis easier. Many bad trades come from buying a decent daily setup against a weak weekly structure.
\nClarity of output matters just as much. If the tool gives you 40 conditions but no ranking, no interpretation, and no entry logic, you still have to do the hardest part yourself. On the other hand, if the tool compresses everything into one simplistic signal with no explanation, trust becomes a problem.
\nThe balance is transparency with structure. You want to know why a setup is being surfaced, but you also want the result in a form you can use quickly. Scorecards, sub-scores, risk labels, and pre-calculated entry and stop zones are all valuable when they are based on visible logic rather than hidden assumptions.
\nPublic verification matters too. Any screener can look smart on a marketing page. What matters is whether its outputs can be tracked over time across different horizons and market conditions.
\nCommon mistakes when using a stock screener with technical analysis
\nThe first mistake is screening for action without screening for quality. Traders often chase volatility because it feels productive. In reality, high movement with poor structure creates more false starts than opportunity.
\nThe second is using the same screen in every market regime. Trending markets reward breakout scans. Choppy markets punish them. In sideways conditions, mean-reversion filters may work better. Your screener should adapt to the environment, not assume the environment will adapt to your rules.
\nThe third is treating the screener as a decision substitute. Screening is the front end of the process, not the whole process. It should narrow attention, improve consistency, and surface better candidates. It should not replace position sizing, risk control, or judgment.
\nThe fourth is ignoring execution. A technically attractive screen result is still a bad trade if liquidity is thin, spreads are wide, or the stop placement is unrealistic. Good screening reduces noise. It does not eliminate the need for discipline.
\nA better standard for screening
\nThe real value of a technical screener is not that it finds stocks. Any platform can do that. The real value is that it helps you move from market noise to a structured shortlist with less contradiction and less wasted time.
\nWhen that shortlist is built on aligned signals instead of isolated indicators, your process becomes more repeatable. When the output includes entry logic, stop levels, and risk context, your decisions become easier to execute. And when the method is transparent enough to verify, confidence comes from structure rather than hope.
\nThat is a better way to use a stock screener with technical analysis. Not as a promise machine, and not as a substitute for thinking, but as a disciplined filter between raw charts and actual decisions.
\nIf your current workflow still depends on opening twenty charts to find one setup worth trading, the issue may not be your market knowledge. It may be that your screening process is doing too little of the heavy lifting.
Tickers mentioned in this article
Open the technical analysis page for each ticker.
All covered tickers →Analyse any ticker with Montbon
Elliott Waves, multi-timeframe moving averages and a 0–100 score. Free to try.
Try Montbon for freeDisclaimer. Content for informational purposes only; not financial advice or a recommendation. Past performance is not a reliable indicator of future results. Montbon Analytics is not an authorised financial intermediary.
Montbon Weekly
Every Tuesday: the stocks that moved most in the week, with source and date. Measures, not predictions.
Send me Montbon Weekly: one email a week, in English, with the stocks that moved most. I can unsubscribe anytime. Privacy
💬 Discussion (0)
Sign in to join the discussion
Sign inMore articles
Reading the Tape: UBER, ABNB, and SHOP in Three Different Phases
A structured technical walkthrough of Uber, Airbnb, and Shopify using range position, momentum, and trend — purely for educational purposes.
Reading the Tape: Ferrari, Amazon, and Meta Through a Technical Lens
A structured look at how trend, range position, and momentum currently frame three widely-watched instruments — purely as an educational exercise.
Range Position, Momentum, and Trend: Reading Three Markets in August 2026
A structured technical walkthrough of Ferrari, Amazon, and Visa — what the data shows and how disciplined traders frame each situation.
Three Stocks, Three Stories: Reading Trend and Range in August 2026
Visa at a 3-month high, Broadcom near its low, UnitedHealth in between — here's how technical analysis frames each situation.